Macro Intelligence Memo — July 2026 PCE
Released August 26, 2026 (BEA Personal Income & Outlays). Memo as of 9:00 ET.
1. Headline read — the Fed's target gauge
PCE headline PCEPI printed +0.16% m/m, +3.70% y/y. Core PCE PCEPILFE printed +0.25% m/m, +3.34% y/y. Supercore PCE IA001260M — services excluding energy and housing, the Fed's "core services ex housing" — printed +0.30% m/m, +3.92% y/y; the BEA-published direct m/m (PP001260M, rounded to 0.1) reads +0.3%, a clean cross-check on the level-computed figure.
The character of the print is benign core over an energy drawdown. Headline is held down by a −1.46% m/m fall in energy DNRGRG3M086SBEA; ex that move, the gauge is ordinary. Core at +0.25% is in line with its trailing pace, and supercore at +0.30% is firm but not a breakout — no component cleared the surprise threshold this month. A print of this shape is consistent with the disinflation-holds narrative rather than a re-acceleration.
1b. Personal Income & Outlays context
Personal income PI rose +0.4% m/m; disposable income DSPI +0.5%; nominal PCE spending PCE +0.2%; the personal saving rate PSAVERT held at 3.0%. Income outrunning spending with a steady low saving rate is consistent with a consumer that is neither retrenching nor accelerating — supportive of the soft-landing framing, with the low saving rate a standing caveat on the durability of real spending.
2. Component detail (m/m, y/y, z-score)
PCE is a Fisher chain index; components are reported standalone, not as an additive partition (see §8). Z-scores use the rolling 24-month window ending June 2026, threshold |z| ≥ 2.
| Component | Series | m/m % | y/y % | z-score |
|---|---|---|---|---|
| Headline PCE | PCEPI | +0.16 | +3.70 | −0.66 |
| Core PCE | PCEPILFE | +0.25 | +3.34 | −0.08 |
| Food | DFXARG3M086SBEA | −0.08 | +2.40 | −1.27 |
| Energy | DNRGRG3M086SBEA | −1.46 | +15.31 | −0.67 |
| Goods | DGDSRG3M086SBEA | −0.11 | +3.72 | −0.68 |
| Services | DSERRG3M086SBEA | +0.27 | +3.69 | −0.23 |
| Supercore (svcs ex energy & housing) | IA001260M | +0.30 | +3.92 | +0.04 |
3. Surprises (rolling 24-month z-score, |z| ≥ 2)
No PCE component breached the |z| ≥ 2 threshold this release. The absence of a flag is itself the read: the energy drawdown, while large in level terms, is within its own trailing distribution, and the core and supercore prints sit close to their 24-month means. This is a quiet-tape release — the underlying trend is neither accelerating nor breaking.
4. CPI ↔ PCE reconciliation (the gauge wedge)
| Metric | CPI m/m | PCE m/m | Wedge m/m | CPI y/y | PCE y/y | Wedge y/y |
|---|---|---|---|---|---|---|
| Headline | +0.07 | +0.16 | +0.08 | +3.30 | +3.70 | +0.40 |
| Core | +0.22 | +0.25 | +0.03 | +2.47 | +3.34 | +0.88 |
| Supercore | +0.19 | +0.30 | +0.11 | +2.99 | +3.92 | +0.93 |
On the month the two gauges agree: Core PCE at +0.25% sits within three basis points of Core CPI at +0.22% (CUSR0000SA0L1E). That monthly agreement is the cleaner read on the current disinflation pulse — both gauges describe an ordinary core month. On a year-over-year basis they diverge: Core PCE runs roughly 88bp above Core CPI, and supercore about 93bp above. The wedge is consistent with the gauges' different construction — shelter carries roughly twice the weight in CPI, while PCE gives greater weight to medical services and captures employer-paid healthcare that CPI excludes. For the reaction function, the level the FOMC targets is the PCE line: it is the gauge running hotter, which is what makes the monthly agreement rather than the annual gap the operative signal for the near-term path.
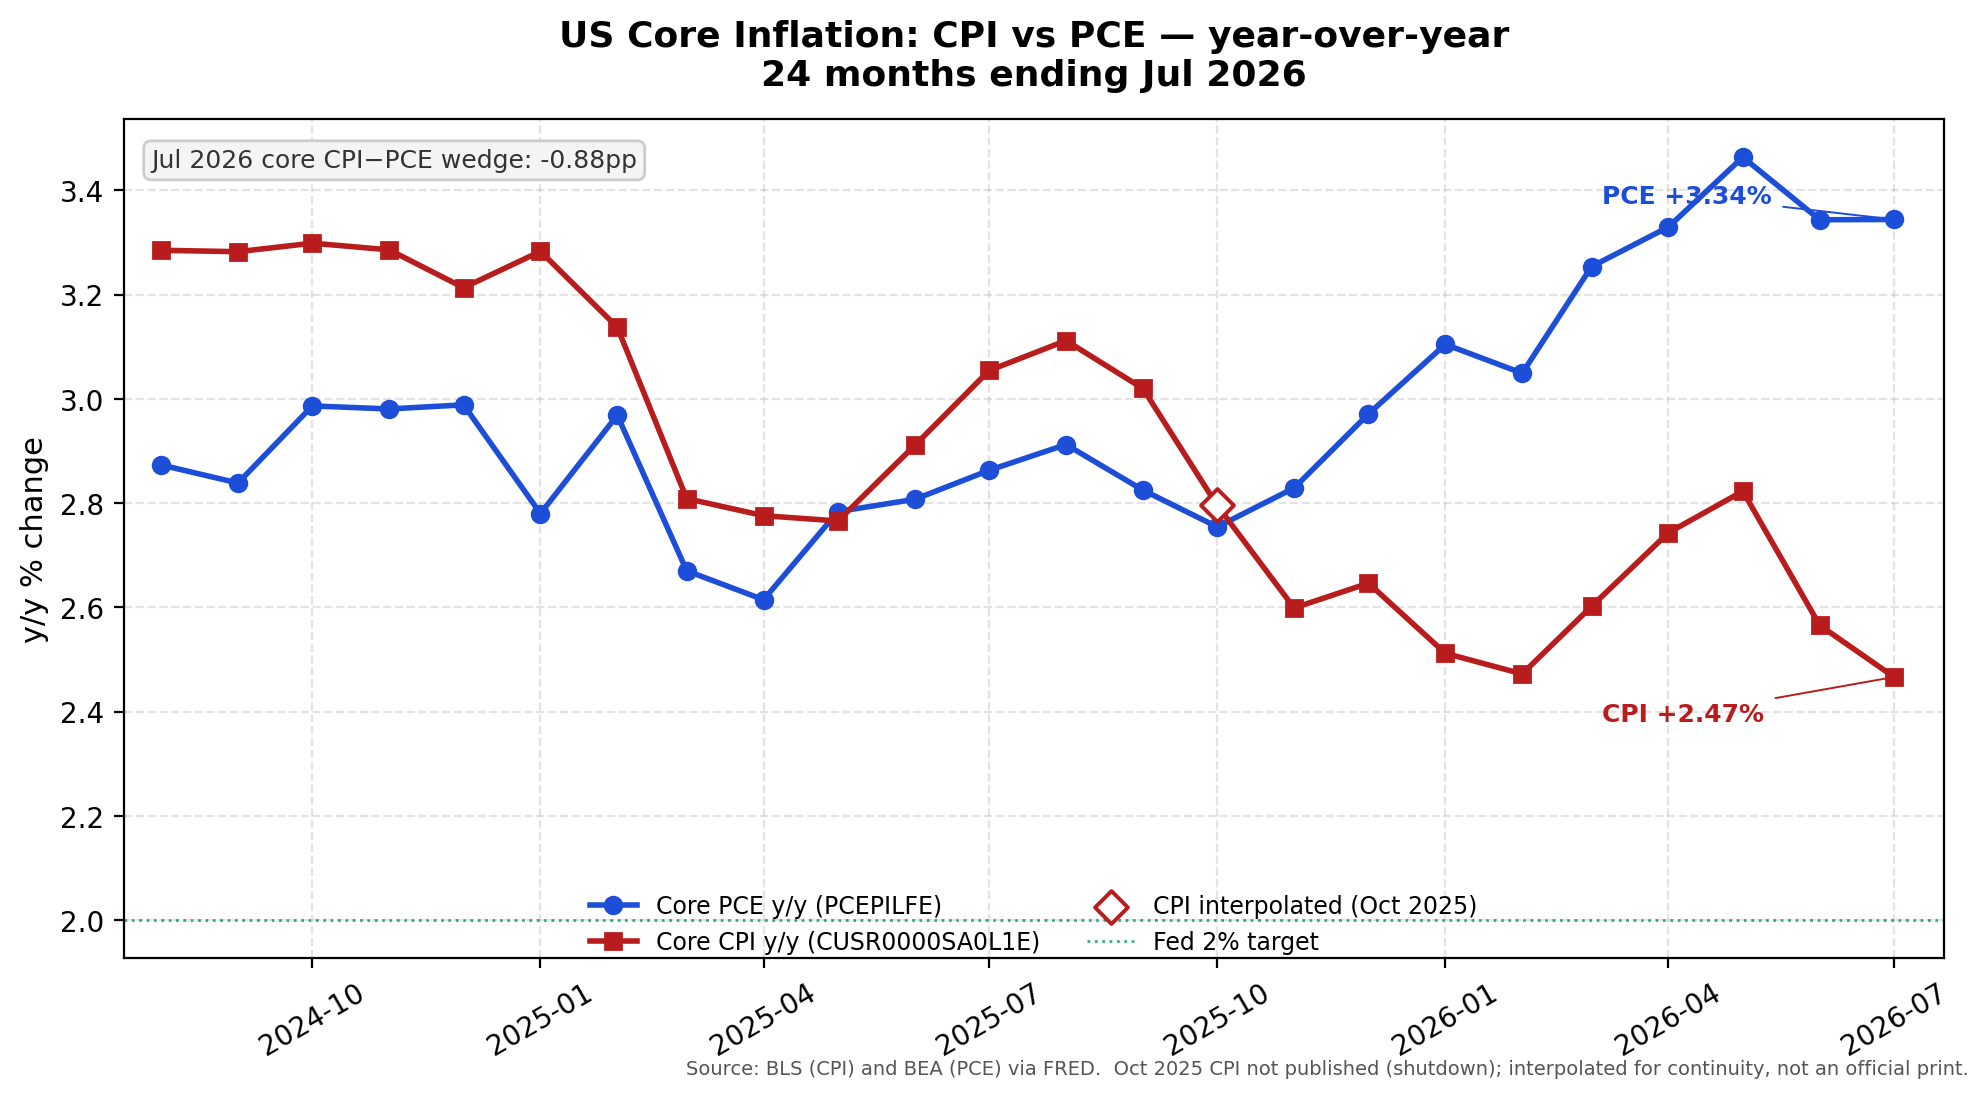
CUSR0000SA0L1E) and BEA (PCEPILFE) via FRED.
5. Portfolio impact by S&P 500 sector
Mapping the data — a reaction frame, not a buy/sell list.
- Energy (XLE) — The −1.46% m/m fall in PCE energy is the headline's dominant driver. A decline of this size is consistent with weaker realized pump and refining margins in the reference month; it would weigh on revenue sensitivity if it reflects a sustained crude move rather than a one-month base effect.
- Consumer Discretionary (XLY) — Softer energy lowers the effective gasoline tax and supports real discretionary income; nominal spending held at +0.2% with income firmer, which is consistent with maintained discretionary volume rather than a pull-back.
- Consumer Staples (XLP) — Food at −0.08% m/m points to easing input-cost passthrough, consistent with margin relief for grocery and packaged-food names provided volumes hold.
- Industrials (XLI) / Materials (XLB) — Lower energy input costs are a modest margin positive; goods at −0.11% m/m shows no renewed cost-push pressure.
- Financials (XLF) — A benign core with a firm-but-not-breaking supercore is consistent with a market pricing a flatter path; the direction for net interest margins depends on which leg of the curve prices the read.
- Real Estate (XLRE) / Utilities (XLU) — Duration-sensitive. A hardening of the disinflation conviction would be a slow tailwind for rate-sensitive REITs; the utilities linkage runs mainly through energy services, which was not the driver this month.
- Tech (XLK) — Long-duration cash flows tied to the back end. The relevant channel is the rate path implied by the soft core, not the PCE line items directly.
6. Tactical positioning bias (rates, FX, equities)
Conditional, not directional commitments. Because PCE is the gauge the FOMC targets, the rates leg is anchored to the core and supercore PCE reading and the CPI-PCE wedge.
- Rates — Core PCE at +0.25% and supercore at +0.30% describe an ordinary month; combined with the soft headline, this is consistent with a market leaning toward an earlier, flatter path. A front-led steepener is the expression consistent with that tilt. Trigger to revise: a subsequent Core PCE print at or above +0.35% m/m, or a supercore re-acceleration above its 24-month mean, would flatten the case.
- FX — Soft US energy and a dovish front end are mildly USD-negative against majors; the same energy softness is a terms-of-trade headwind for petro-FX (CAD, NOK), so the crosses partly offset. Trigger: a rebound in PCE energy back above its window mean reverses both legs.
- Equities — A firm supercore against a soft headline is consistent with a quality-growth tilt over short-duration value, conditional on the curve actually pricing the dovish read. Trigger: a goods-price re-acceleration in the next PPI or CPI would pivot the tilt back toward cyclicals.
- Hedge / condition — The framework is conditional on July's softness being trend rather than an energy base effect. The cleanest falsification is the next print: an energy mean-reversion that lifts headline PCE back toward +0.25% m/m would invalidate the dovish leg across rates, FX, and equities simultaneously.
7. Week-ahead release watch (August 27 – September 2, 2026)
- ISM Manufacturing — prices paid. The producer-pipeline read on whether the soft goods-price signal is holding upstream. A jump here would be the first warning that consumer prices lag rather than lead.
- Initial Jobless Claims (weekly). The labor cross-check on the dovish-path repricing. A break above the recent range reinforces the tilt independent of the inflation data.
- Consumer confidence / U. Michigan inflation expectations. The expectations anchor. A drift lower in the 1-year measure would corroborate the benign supercore; a re-anchoring higher is the cleaner reason to fade the dovish rates leg.
- Next CPI (mid-September). The matched gauge. Watch the CPI supercore against this month's PCE supercore — a widening wedge changes which gauge is decisive for the Fed.
8. Methodological notes
- Gauge: PCE (BEA Personal Income & Outlays), pulled from FRED, which ingests the BEA release same-day. The release email from the Bureau of Economic Analysis is the trigger.
- No additive contributions: PCE is a Fisher chain index; its components do not sum additively to the headline (unlike CPI's chained-Laspeyres partition, which closes to ~100% with a small closure error). Reporting a forced-additive partition on PCE would carry a structurally large, misleading closure error, so cuts are reported standalone with m/m and y/y.
- Supercore PCE =
IA001260M(services excluding energy and housing), a BEA-published series — the PCE analog to the CPI narrative supercoreCUSR0000SASL2RS. The direct m/m seriesPP001260Mis retained as a cross-check on the level-computed figure. - Z-score window: trailing 24 months ending June 2026, m/m % change, threshold |z| ≥ 2 — the same specification as the CPI tier.
- CPI ↔ PCE wedge: computed from the matched CPI release; the monthly agreement is framed as the cleaner disinflation read and the y/y wedge as the weighting artifact.
- Source provenance: raw FRED responses cached with timestamp under
outputs/pce_2026-07/raw/. Series IDs are cited inline.
Subscription tier: Macro Intelligence. Component matrix and CPI-vs-PCE wedge available as components.csv and cpi_pce_wedge.csv in this release folder.