Real-Time GDP Nowcast — 2026 Q3
As of September 19, 2026. Advance estimate scheduled for October 29, 2026 — 5.7 weeks out.
1. The read
Our nowcast for 2026 Q3 real GDP growth reads +2.51% annualized (SA). The published figure is the frozen 50/50 blend of the indicator model and the historical mean, evaluated at the 4-week horizon — the run sits 5.7 weeks before the advance release, which maps to the nearest fixed horizon in the specification. It is built only from data available on September 19, reconstructed from ALFRED vintages, so nothing that had not yet been released enters the estimate.
2. Where the desk stands
The same target quarter, on identical information as of the run date:
| Nowcast | 2026 Q3 | As of | Construction |
|---|---|---|---|
| QuantVeritas — frozen | +2.51% | Sep 19 | 50/50 blend: indicator + historical mean |
| QV indicator ridge | +2.43% | Sep 19 | ridge on a 12-series real-time panel |
| QV historical mean | +2.59% | Sep 19 | expanding unconditional mean |
| QV AR ridge | +2.60% | Sep 19 | ridge on GDP lags 1, 2, 4 |
| Atlanta Fed GDPNow | +5.08% | Sep 17 | bottom-up, 13 GDP subcomponents |
| NY Fed Staff Nowcast | +2.33% | Sep 18 | Bayesian dynamic factor model |
| Philadelphia Fed SPF (mean) | +2.72% | Aug 14 | survey consensus (quarterly) |
The QuantVeritas estimate sits between the NY Fed (+2.33%) and the SPF (+2.72%). GDPNow is the outlier at +5.08% — expected this early in a quarter, when few hard source series have printed and the bottom-up tracker leans on its bridge-equation forecasts; it typically converges toward the others as the quarter's data fill in. The SPF is quarterly and is therefore the stalest input at this horizon, unchanged since its August release.
3. What the components say
The indicator model reads a compact panel of twelve monthly series, each transformed and aggregated over the months of the quarter already observed: total nonfarm payrolls, the unemployment rate, industrial production, retail sales, housing starts, building permits, durable-goods orders, business inventories, CPI, core CPI, the PCE price index, and University of Michigan consumer sentiment. On the data in hand through August, that panel maps to roughly +2.4%; the historical mean and the AR term pull the blend up toward +2.5%.
4. Convergence toward the release
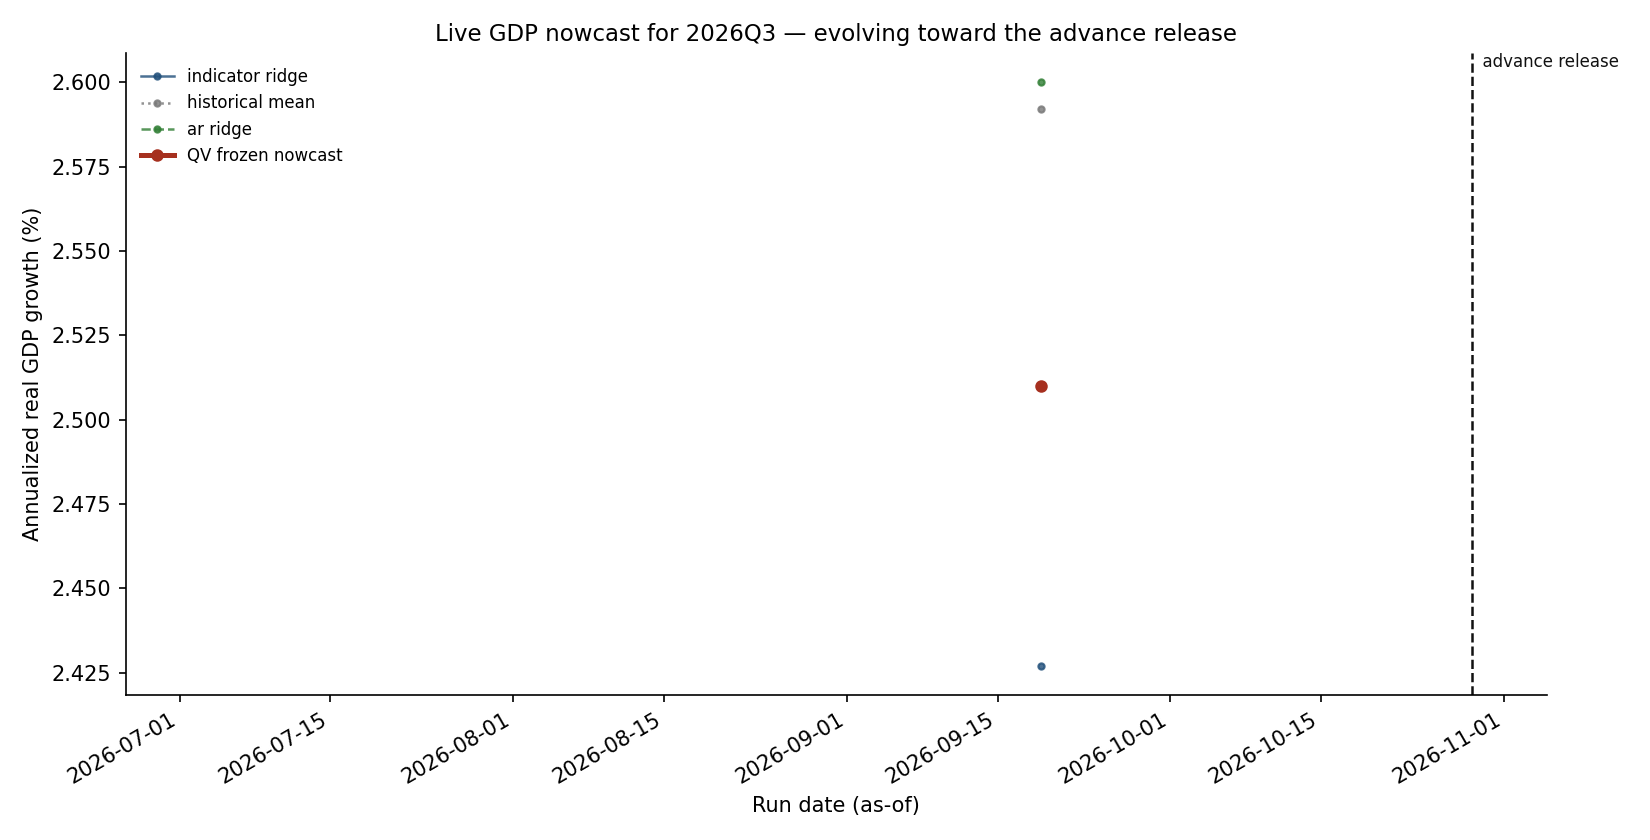
GDPC1, same-vintage reconstruction from ALFRED.
The nowcast is refreshed weekly. As each 2026 Q3 indicator is released, the estimate is re-run on the enlarged information set and the line moves toward the October 29 advance print — the object it is trying to forecast.
5. How it is scored (the Proof of Competence)
The point of an independent nowcast is that it either matches the institutional systems or says precisely where it does not. Scored out-of-sample on identical target quarters and forecast dates, under ordinary conditions (excluding the two extreme pandemic quarters):
- One week out — the blend's RMSE (~1.61) is within 1.1% of the NY Fed Staff Nowcast and about 8.8% better than the SPF, but trails GDPNow by roughly 37%.
- Four weeks out — within about 0.8% of the SPF and 7% of the NY Fed; GDPNow retains an edge.
- Eight weeks out — the recursive inverse-MSE combination is within a few percent of all three benchmarks, and marginally ahead of GDPNow on the matched sample.
Competitive, not superior. None of these differences is statistically significant at conventional levels, and GDPNow keeps a real short-horizon advantage from its detailed use of GDP source data. On the full sample — including 2020 Q2 and 2020 Q3, which we retain because every forecaster faced the same shock — the institutional benchmarks generally win. The claim here is measured accuracy on matched samples, not a universal ranking.
6. Market implication (conditional; not a directional call)
A nowcast that diverges materially from the institutional consensus at the one-week horizon is the point worth flagging, and the direction of any GDP surprise relative to that consensus is what tends to move the front end of the curve. This tier is a forecast-accuracy diagnostic; it carries no positioning bias of its own and does not feed the OIS-repricing model. A directional rates, FX, or equity view would appear only behind that explicit model output — never on the nowcast alone.
7. Week ahead — what moves the 2026 Q3 estimate
Between now and the October 29 advance print, the releases that will move the nowcast are the September employment report, retail sales, industrial production, durable-goods orders, and the trade and inventory data — each one enlarges the observed portion of the quarter and is re-run through the panel the morning it lands. The single-week gap to GDPNow and whether it converges toward the +2.3% to +2.7% cluster is the thing to watch.
8. Methodological notes
- Target: the BEA advance estimate of annualized quarter-over-quarter real GDP growth, reconstructed same-vintage from ALFRED
GDPC1(validated against the direct initial releases to within 0.049 percentage points). - Real-time discipline: every forecast is recursive and uses only target outcomes from prior quarters and predictor data available at the run date, reconstructed from ALFRED vintages. Missing current-quarter observations remain missing; no revised history is substituted.
- Horizon mapping: the run date is mapped to the nearest fixed horizon among 8, 4, and 1 weeks-to-release, and that horizon's model is used with current-quarter features built as of the run date. This run maps to the 4-week horizon.
- Frozen specification: the 1- and 4-week horizons publish the 50/50 blend of the indicator model and the historical mean; the 8-week horizon publishes a recursive inverse-MSE combination. The specification was fixed in advance and is not re-tuned per quarter.
- Benchmarks: Atlanta Fed GDPNow, the NY Fed Staff Nowcast, and the Philadelphia Fed SPF mean, each matched to its latest observation published strictly before the run date for the same target quarter; reconstructed archive history is excluded from the live scoring.
- Known limitation: the model does not yet build GDP from its expenditure components under the accounting identity, which is GDPNow's structural advantage at short horizons. The next development stage adds that component structure.
Subscription tier: Macro Intelligence. The full matched-forecast table, per-model metrics, and combination scorecard are available as matched_forecasts.csv, metrics_live_only.csv, and combination_pairwise_focus.csv.